
The objective of the Stockradar strategy is to grow a portfolios of stocks value year on year regardless of movements in the wider market. The key plank of this strategy is to maximise gains and keep capital safe but also to show members how to achieve that through an education process that culminates in a live trading process (Stockradar Trading Centre) using our methods.
We choose price as our analysis tool, believing that as it is price we trade and profit from it is price movement we must understand and analyse.
We then use a systematic process to ensure total control of all aspects of our strategy which includes not just an analysis method but also decisions on how to manage risk, how many stocks you draw your selections from (160 leading stocks), to the size of the portfolio of stocks you hold. These controls are imperative to success
Stock selection for our trading models is determined by a consistent and systematic method, based on an algorithm I have developed called the Trend Intensity Indicator which identifies up-trending stocks. It combines the price trend, volume, moving averages, and momentum price indicators to identify stocks in the early stages of a new uptrend. The Trend Intensity Indicator rates a stock between +10 and -10. Stockradar’s main page the Trading Centre, identifies all qualified trending stocks each with the own Trend Intensity Rating.
Stockradar’s weekly based model historically shown growth, though returns are not guaranteed, in a both bull and bear phases with 20 years of published results. This systematic trend following strategy is protected by predetermined risk limits on all positions to ensure the safety of capital.
1. Trend Reversal.
This occurs when a downtrend of lower lows and highs is reversed to an uptrend of higher highs and lows. A Trend Intensity Rating of +4 or greater must be achieved to qualify a Trend Reversal. If a Trend Reversal doesn’t achieve a qualifying rating, the reversal level is moved up to the next resistance level.

2. New High.
We buy new weekly highs. Also if we have previously been stopped out of a trade still buy a new weekly high to ensure we are always exposed to any potential new up trend phase. A Trend Intensity Rating of +4 or greater must be achieved to qualify a New High.

Either of these 2 conditions must also then be confirmed by Trend Intensity Indicator rating of +4 or greater. Scale of -10/+10.

1. Stop Profit/Loss
To manage our positions a stop is firstly set at a predetermined risk level of 15% which then trails the price higher as the market moves up. The stop is never moved down thus our total risk on any trade is 15%. We do not carry large drawdowns.
Trailing Stop
a. A Stop Loss is initially set at a maximum risk level of 15%.
b. The Stop Loss/Profit is raised within boundaries of 10-15% below the highest weekly close since entry.
c. Stockradar uses price lows, closes and moving average levels to set stops within that 10-15% boundary.
d. Never move a stop down – always up.
e. Moved to breakeven ASAP.
f. Only weekly – Stops are never on the market. Stops are triggered by Fridays close and executed on Monday.
g. If stopped out we always re-enter on a New High that re-qualifies up trend status.
h. Accelerated Stop Profit. The Stop is raised to less than 10% in instances where price hesitates at a resistance level or the price begins to move fast and exponentially.
i. 1% violation rule. Stops must be violated by 1% or more to confirm the trigger of a Stop.
All signals, both entries and exits, are triggered by Fridays weekly close and benchmarked against Mondays opening prices

This Strategy ensures we are always exposed to an uptrend.
A simple money management process that effectively cuts out the big losses and leverages stock trends.
There are four potential outcomes of a trade:
Small wins and losses effectively cancel themselves out. Big losses are excluded by our strict money management process so that leaves us with the big wins and that’s the key driver of portfolio growth.
Other details of how we manage a portfolio of stocks with regard to the trade execution process, guidelines on stops, takeovers, dividends, stock inclusions and exclusions, and stocks under offer, can all be found in the About section of Stockradar, Guidelines to Using Stockradar .
Members often ask me for more information about how we construct a smaller more manageable portfolio of stocks, so I briefly outline the process below for you.
PORTFOLIOS AND THEIR CONSTRUCTION:
PURPOSE:
To filter the many Stockradar Stocks Picks into a smaller and more manageable portfolio of stocks for you. We use controlled filters such as market capitalisation limits, sector weightings and other necessary portfolio management criteria. The Stock Picks we generate using the above stock selection template are ranked for you for easy entry into these smaller portfolios.
There are two types.
A) Supercharge your portfolio with the Energiser Portfolios:
This portfolio leverages our stock picks by using a stock universe of the Top 100 Stockradar stocks from the total Stockradar data universe (160 approx.). We run two types of Energiser portfolios. One holds just 5 stocks and the other 10 stocks. This ensures a high equity component for these portfolios and under most market conditions they are full. If a portfolio is full one stock must drop out to allow room for a new stock to be entered.
B) A very Conservative portfolio:
A universe of 20 stocks has been defined and consists of top stocks across each sector for both safety and diversity. Of the 20 stock universe a maximum of up to 10 stocks can be included in your portfolio of stocks with capital divided equally between the 10 stocks. As the portfolio grows so to does the capital allocations to each buy. You buy a stock (1/10th of capital) when a signal is generated from the Stockradar model; otherwise, that portion remains in cash. This gives you a ‘binary’ portfolio of either an equity or cash component for each of the 10 allocations.

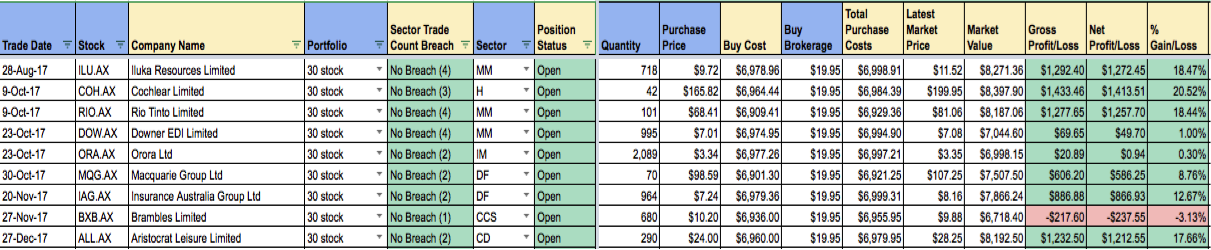
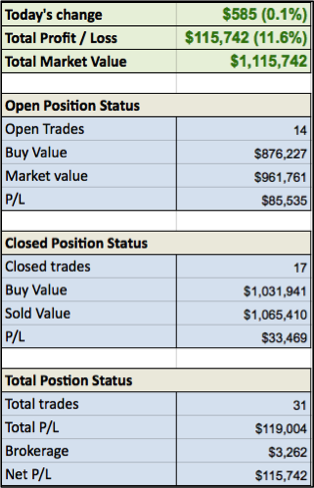
With the Stockradar model portfolio service you gain access to a live 24/7 Share Trade Tracker with a comprehensive trade sheet and a ‘dashboard’ that breaks down your share-trading performance into one simple view.
Example Trade sheet
Example Dashboard
TRADING COSTS:
Portfolio members execute their own trades on their own online trading platforms. This keeps trading costs to a minimum. All monies remain in your own name and account.
To find out more contact me directly at Richard@stockradar.com.au
My portfolio has hit my projected target, thanks a lot to the very sound direction and education you have provided. I now feel very confident about the future and look forward to many years of further investment. Thanks again. – Norman J
and …
Stockradar is key in giving a great heads up over investment advisory services. Analysis of stock-market price behaviour is an indispensable and necessary tool that runs ahead of not-yet-publicly declared news. The weekly entry/exit model format is a welcome and wise release. Like any ‘system’ it does not offer a nirvana-heaven for investors but is an extremely sound and vital investment tool. – Stephen Marshall – Stockbroker, Ord Minnett
and another…
I joined ‘X’ broker early in July 2015 with $500,600. It seemed a good idea. ‘X’ broker would stock pick and actively manage the SMSF. Sadly my portfolio diminished to $400,500. That’s a loss of $100.000 in less than a year. It turned out to be set and forget with a focus on Banks and dividends. I lost 25 % on NAB and they told me we still like the stock. I have a number of stocks that have been in the red from the day I bought them. I joined Stockradar and started instructing my adviser what to buy. I am seeing greens shoots all over my portfolio. ANN up 6% CTD up 19%, ORA up 9%, SEK up 2%, SIP up 31% VOC up 10%. – Mervyn J